I can't believe I'm posting this. Real life right?
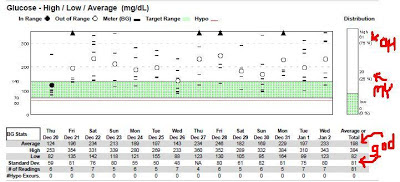
Pink's blood sugars for the last two weeks:
That's ugly.
Out of nowhere, Pink's insulin needs skyrocket. Growth spurt, puberty pogo, pancreas kaput...who knows? (plus I obviously was slacking as the chart above depicts) Last time this happened I ended up increasing Pink's TDD (total daily dose of insulin) by 30% which was about 9-10 units.
But it took me FOREVER.
Little by little. Chicken by scaredy-cat chicken day.
I swore to do better, faster next time.
I've been upping basal for the last few days. Changing them almost across the board at once instead one by one. Thinking I'm busting a move all over these highs. So why isn't it working?!
basal patterns started here
(basal insulin works day and night to control blood sugar between meals and during sleep)

(basal insulin works day and night to control blood sugar between meals and during sleep)

and now we are here
PUH-LEASE!
Do the math and that only adds up to 1.25 more units per day so far.
Must do better.
THIS IS NOT MEDICAL ADVICE.
DO NOT USE OUR METHODS, NUMBERS OR PATTERNS.
GET YOUR OWN...
FROM YOUR MEDICAL TEAM.


Hey now...the 24th through the 26th look pretty good to me!!!
ReplyDeleteAND, looking on the bright side, no lows! That's good. Gotta look at the good.
ReplyDeleteI think that's part of my problem. I'm not so petrified of the lows anymore but I HATE how she feels bad. Even something in the 80s can take her out for 45 min. During the busy holidays there were just enough in-range numbers for me to fool myself into thinking we were doing (not great) but OK for the upheaval of routine. Thanks for the support!
DeleteFWIW, you're way ahead of me. I can't read the graphs or begin to fathom the depths of information I am missing.
ReplyDelete"Chicken by scaredy-cat chicken day." <--that I totally get.
Really, these graphs are not the best but do give me a quick big picture and do all the total/average math for me and give me a standard deviation. I wish it would give me a line graph so I could see a linear relationship between the numbers. Did a high come right down or did it take me 1/2 day to get it down. And I can't customize which days I look at. I can get single days of info but then have to jump to 2 weeks. What if I want 4 days to see what adjustments have done just on those days? Sorry - I have issues with why there are not better tools to help me with all this info that we gather.
DeleteIs this from Diasend?
ReplyDeleteNo. We have Medtronic Minimed pumps. It's Carelink. We can also upload the pumps from home and the doc and look at the data in the office.
Delete